L&TD
LOGGING & TESTING DIVISION
DPP&PETROSITE Desktop Petrophysics Software
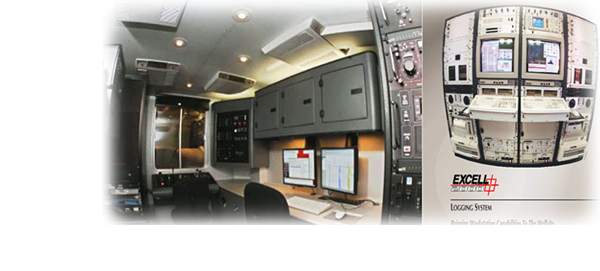
In order to provide the best results from wireline logging data processing/interpretation, from 1997 Vietsovpetro L&TD starting to utilize a full range of processing/interpretation programs. This is Halliburton’s Desktop Petrophysics software and Petrosite software running in a complete system. The system comprises two IBM-RS-6000 servers running in AIX environment with six terminals connected through a LAN and one HP workstation running in Window environment. This is a multi task and multi-user system. 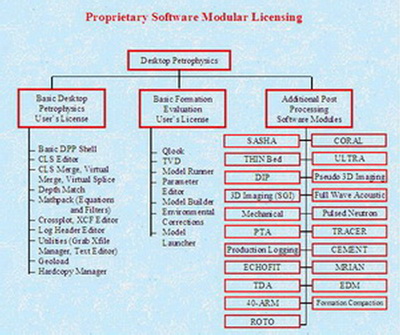 |
| Halliburton’s Desktop Petrophysics (DPP) and Petrosite are integrated software packages that converts, stores, analyzes, and manipulates log data. The Desktop Petrophysics&Petrosite suite of applications allows the user to manage and manipulate log data for further evaluation and interpretation.
The DPP & Petrosite applications run cohesively in a common “desktop” environment under OSF/Motif TM, thus offering a consistent user interface based on the X-Window system.
All DPP& Petrosite applications run from a common CLS database, and use a single messaging system to communicate with one another. |
Offered as a package, but available as individual applications, Desktop Petrophysics&Petrosite provides the tools needed to meet the demand for more in-depth reservoir analysis and evaluation.
The DPP & Petrosite applications are grouped. There are main groups: Basic Desktop Petrophysics, Basic Formation Evaluation Package and Additional Post Processing Software Modules. Each application in the Desktop Petrophysics & Petrosite suite is described briefly below. |
| A- BASIC DESKTOP PETROPHYSICS & PETROSITE PACKAGE
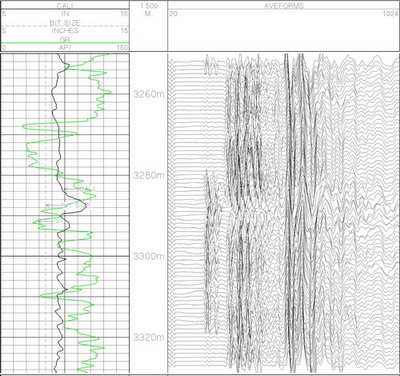
GEOLOAD Converts Log Data between CLS Database format and LIS and LAS formats. Also can output ASCII file and verify LIS. CLS EDITOR View and edit Log Data in CLS Database file in value versus sample depth matrix. Create, delete, rename or copy curves. SCROLLPLOT Interactively display CLS log data on screen, or output as TIFF file. Annotate logs, label/rescale curves, plot special curves (waveform, image, dip arrow, etc.). SPC EDITOR Build/edit a Scroll Plot Control file (.spc) to format plots run from the Scroll Plot program. |
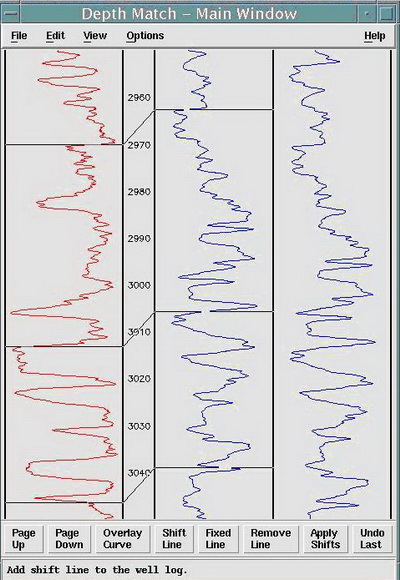 DEPTH MATCH Graphically stretch, compress, or linearly shift curves in CLS Database. DEPTH MATCH Graphically stretch, compress, or linearly shift curves in CLS Database. |
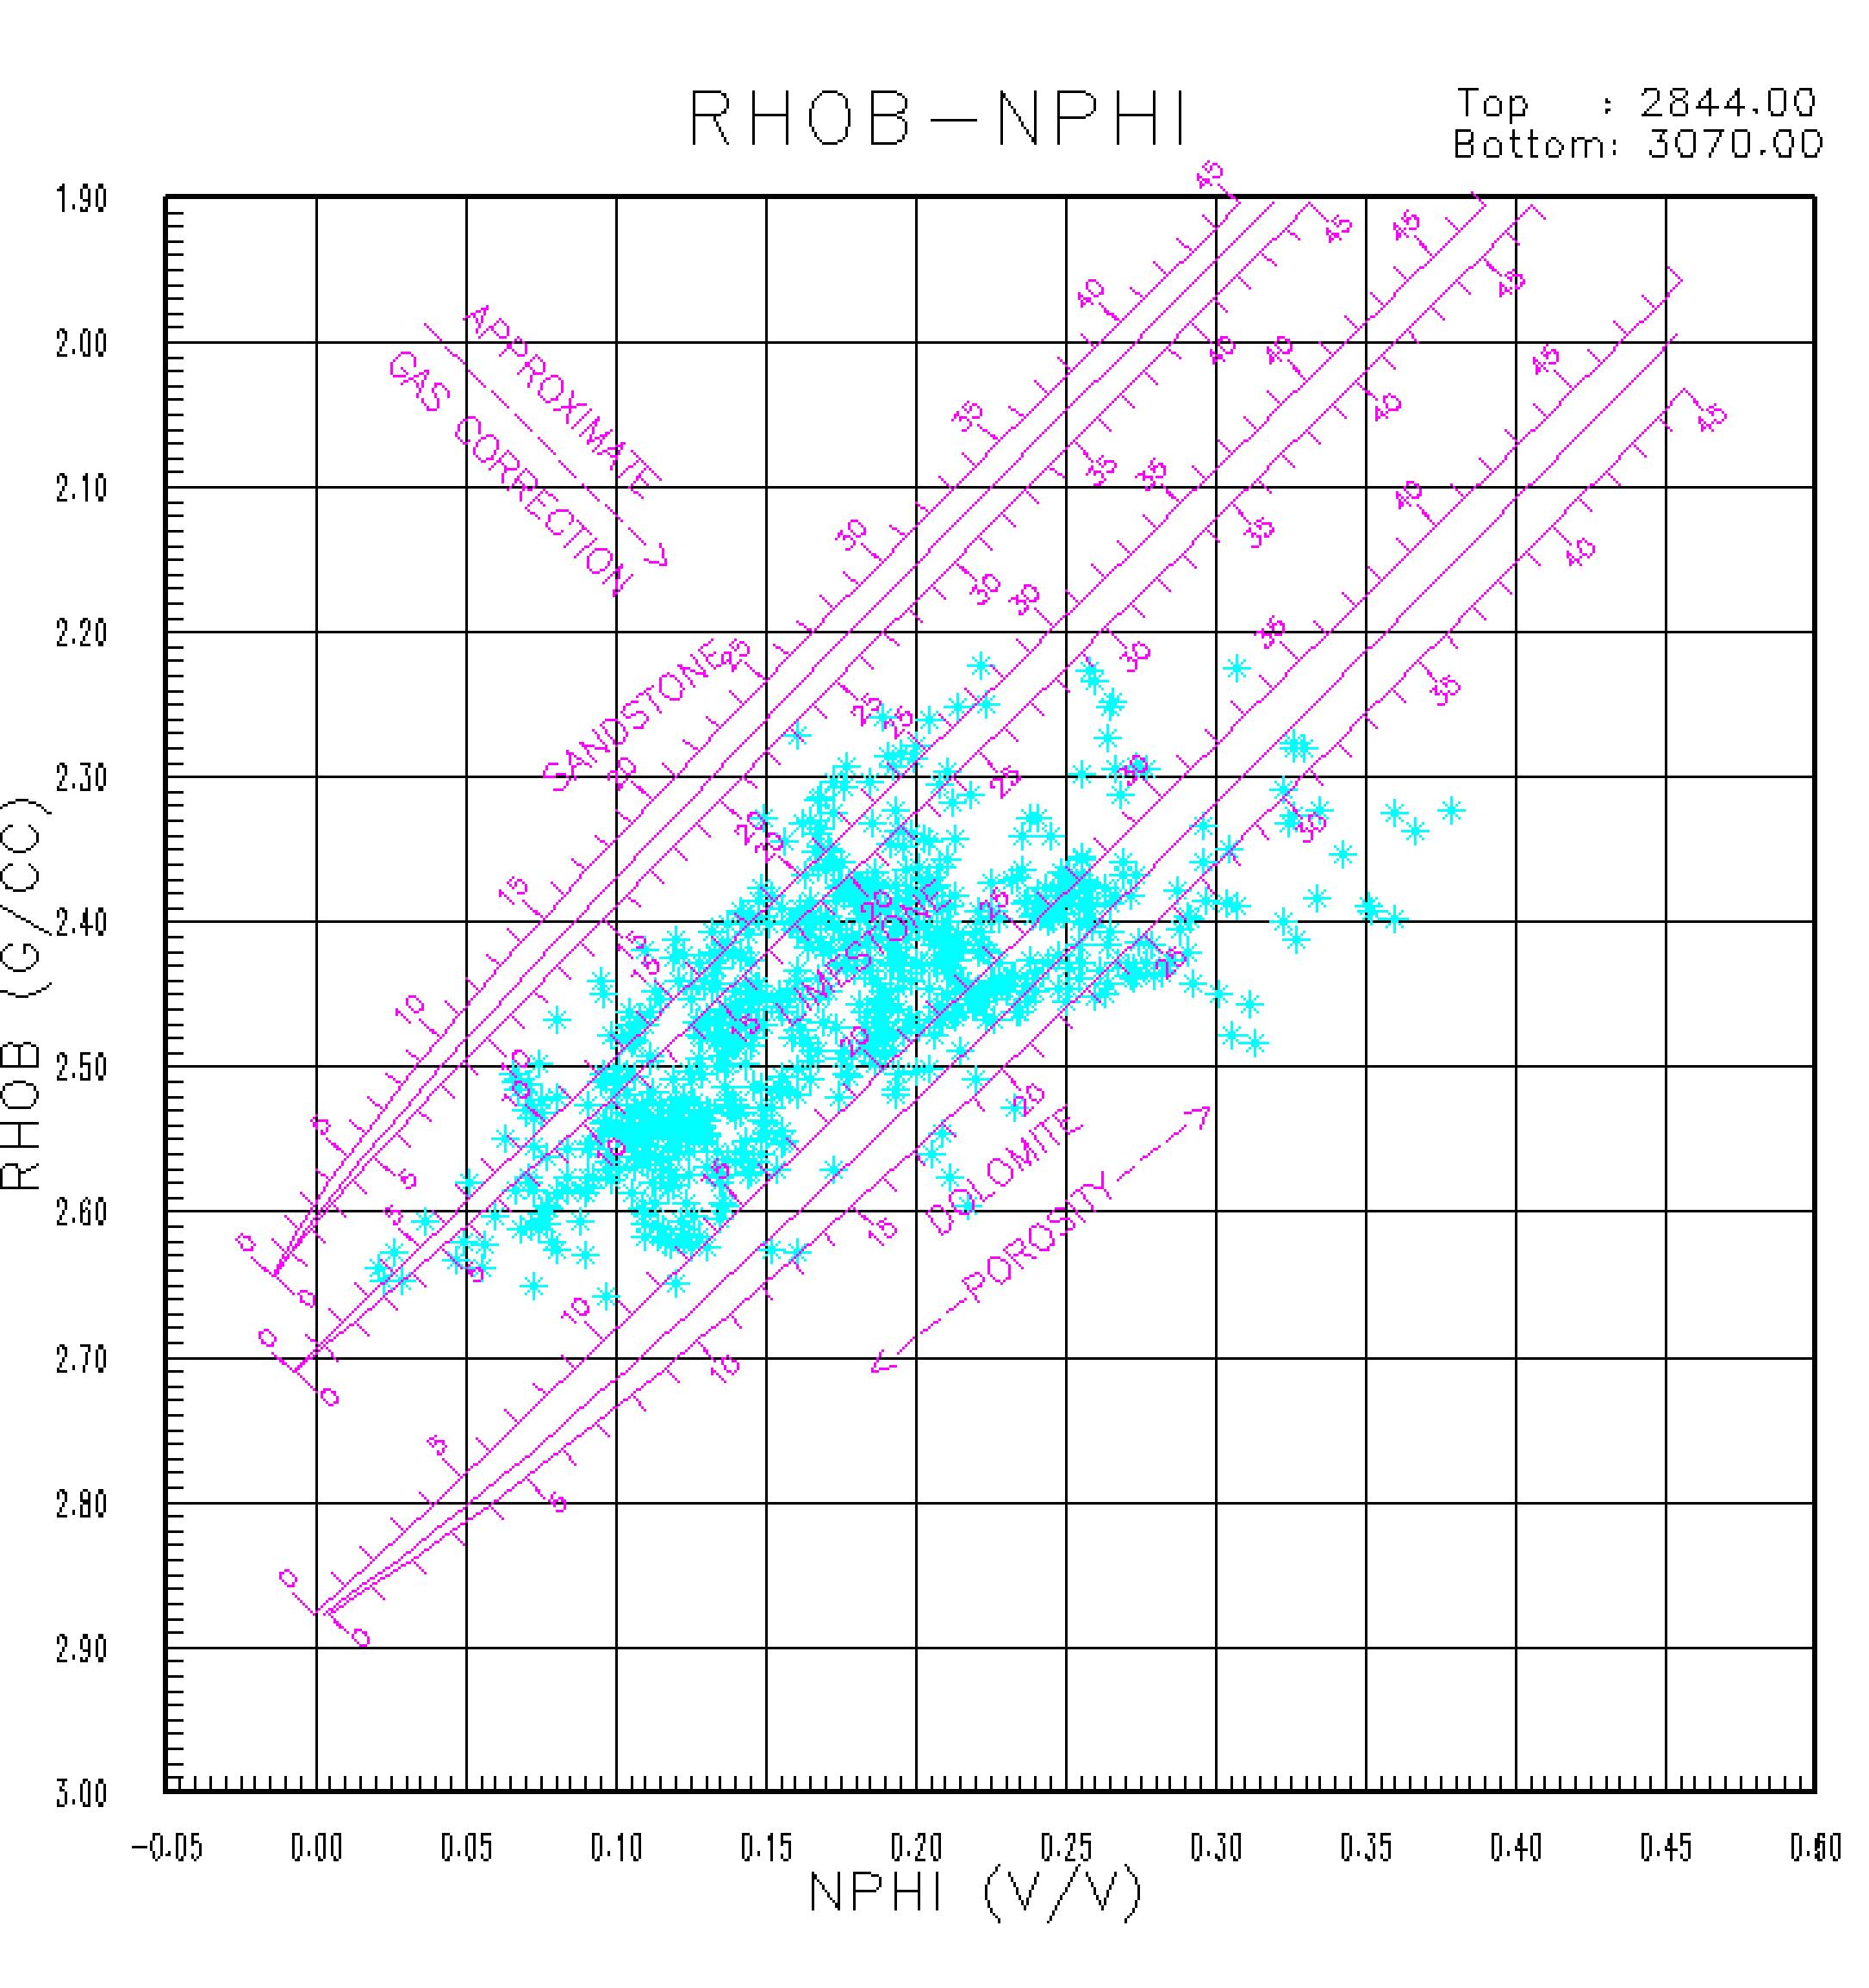
XCF EDITOR Build/edit a Cross Plot Control file (.xcf) to format plots run from the Cross Plot program. |
|
HARDCOPY MANAGER Plot TIFF file of logs, cross plots, and screen dumps on selected plotter. MATHPACK Perform mathematical, logical, filter operations on CLS database curves, and save processing steps as user programs. Display data histogram with statistical calculation. LOG HEADER EDITOR The Log Header Editor program is used to generate API standard log headers to include with plots produced by other Desktop Petrophysics application. You can select from a list of header types that include Open Hole, Cased Hole, and Formation Tester. The Log Header Editor program has the option to read the information stored in the CLS database. The HardCopy Manager program to generate the header plots for the different plotters uses data saved by the program. B- BASIC FORMATION EVALUATION PACKAGE QLOOK is a quicklook to complex reservoir analysis model. Although the program will function with a minimum of one porosity data input, one clay determination data input and one deep resistivity data input; it provides improved results with additional input data. The program determines any 3 mineral combination from a list of 17 available minerals; plus clay; when density-neutron-Pe-resistivity data are available. When sonic travel time is added, the sonic enhances the program’s ability to deal with bad hole or to provide secondary porosity determination or both. The addition of flushing zone resistivity allows for a moveable hydrocarbon plot. QLOOK features several computational options including: selection of desired clay indicators, selection of gamma ray – Vcl transformations, and selection of water saturation models. QLOOK contains a microlog indicated permeability routine that complements the standard computed results if micro-electric data is present. |
|
Model Builder This feature enables anyone with Fortran programming knowledge to develop analysis or other data manipulation programs which can access the CLIS database well file in a simple and straightforward manner. The model developer generates two files, a .MDS file which specifies the input and output parameters and processing options, and a .MDL file which contains the Fortran algorithms. The system will then build an executable program that allows Model Runner access the CLIS database and JOBVAR database as required.
Model Runner Sets up model control parameters and interactively run the model.
Parameter Editor Edit environment parameter values used in analysis models by user-defined depth zones and store in parameter database.
Environmental Corrections Library for both Halliburton and Schlumberger tool responses. |
 TVD
TVD| C- ADDITIONAL POST PROCESSING SOFTWARE MODULES
CORAL (COmplex Reservoir Analysis Lithology) This model provides an accurate, detailed description of reservoirs with mixed lithology. Its primary use is in the evaluation of formations, which contain shale, sand, limestone, dolomite, anhydrite, and gypsum. Minimum log data consists of a Gamma Ray or Spontaneous Potential, Induction or Laterolog resistivity, and Neutron and Density logs. Improved results are obtained if photoelectric (Pe), shallow resistivity, Sonic, Dielectric, and Spectral Gamma Ray data are used. SASHA (SAnd SHale Analysis) This model is designed to evaluate shaly sand reservoirs. The program computes the volume of shale, type of clay distribution, porosity, density of hydrocarbons, and water saturation. SASHA analysis is based on the Density-Neutron cross plot. Limited computations can also be accomplished when only one porosity device, or the combination Density-Sonic is available.THIN BED LARA (Laminated Reservoir Analysis) This makes use of dipmeter (or other high-vertical-resolution shale indicators) and a standard openhole log suite to analyze thinly laminated shaly sand reservoirs where clay content varies with depth. LARA’s algorithms determine shale volume, clay distribution, porosity, water saturation, and hydrocarbon density of thin-bedded formations. ULTRA (Universal Logging Tool Response Analysis) This is a weighted-least-squares error minimization technique which provides the analyst extensive flexibility to choose parameters, log measurements, and interpretive models. The effects of trace minerals, such as pyrite or ankerite, can be accurately evaluated with the ULTRA program. The analyst can also incorporate core results and other petrophysical data into ULTRA analysis to enhance the interpretation. |
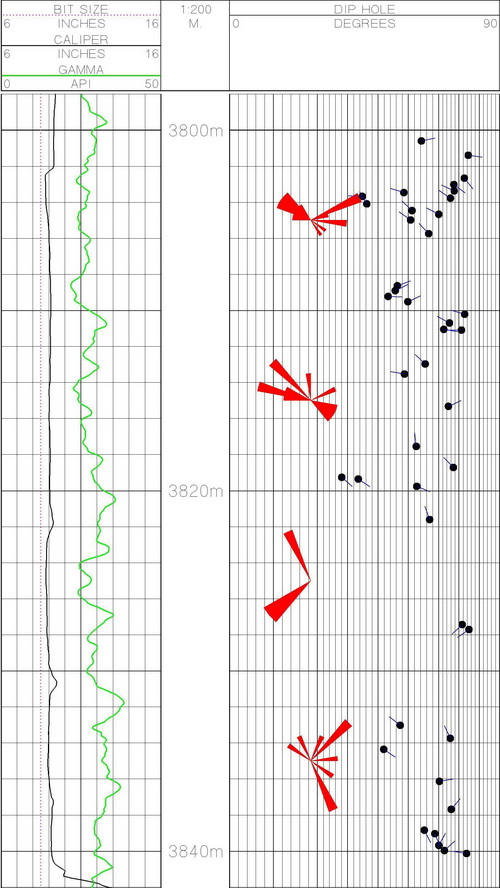 |
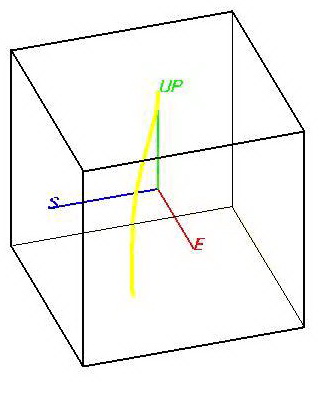
DIP ANALYSIS SHIVA A planar global mapping computational module for four or six arm dipmeters. SHIVA analysis relies on a weighted-least-squares optimization approach to make optimum use of redundant data. OMNI A global mapping computational module for curved surfaces for six arm dipmeters. OMNI is a variation of SHIVA analysis that evaluates non-planar bedding. If dips are planar. OMNI will produce the same dip angle and azimuth as SHIVA analysis. ORATOR Oriented resistivity processing of dipmeter data for fracture detection. ORATOR results also indicate the orientation of fracture anomalies. The ORATOR plot is made by comparing each diameter pad’s measurement with that of the adjacent pads.
|
|
IMAGING - Pseudo 3D or Advanced 3D
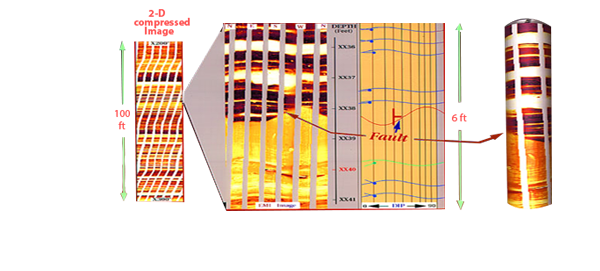
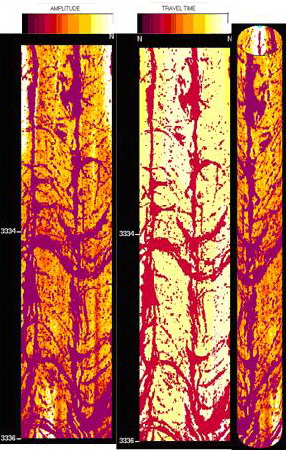
CAST Image enhancement of CAST data can be done to improve geologic interpretation, fracture analysis, and bed definition. This model allows histogram equalization of CAST data. CAST images can be plotted as 360 o two-dimensional or three-dimensional cylindrical images that can be rotated. Interactive dip and fracture plot can be obtained by matching a sinusoidal to the image features.
EMI Image enhancement of EMI data can be done to improve geologic interpretation, fracture analysis, and bed definition. This model allows histogram equalization of EMI data. EMI images can be plotted as two-dimensional or three-dimensional cylindrical images that can be rotated. Interactive dip and fracture plot can be obtained by matching a sinusoidal to the image features |
 |
 |
FULLWAVE ACOUSTIC allows processing of the acoustic waveform to compressional, shear and stoneley components by semblance correlation |
|
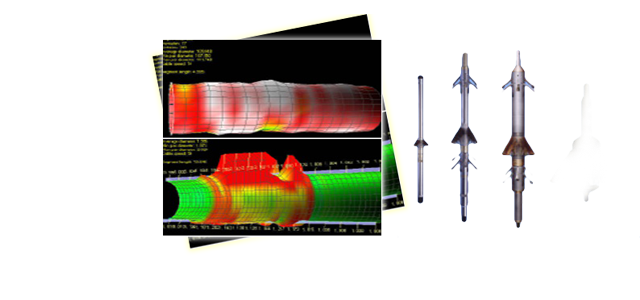
Mechanical Properties allows for rock elastic properties from Acoustic Dt compressional and shear combined with density measurements via ROCKXPERT. TRANSIENT PRESSURE (Pressure Transient Analysis) PTA evaluates the raw pressure-versus-time data recorded by formation testers. PTA output includes a modified pressure-versus-time plot, formation permeability and initial formation pressure. Both radial and spherical flow models are available and the results can be plotted as Horner or derivative plots.TRACERSCAN Seven models are used to evaluate the vertical and radial locations of radioactive tracer isotopes used to tag fracture, gravel pack, or cementing operations. The program uses CSNG spectra in a weighted least squares fitting technique to determine distributions for single or multiple tracers. |
Nhóm Marketing